Introduction to R Software
R is a open source statistical software. R
software can be downloaded from the following link . https://www.r-project.org/
There are few GUI available for R software
Starting the R environment (This page uses the R-Studio GUI for examples )
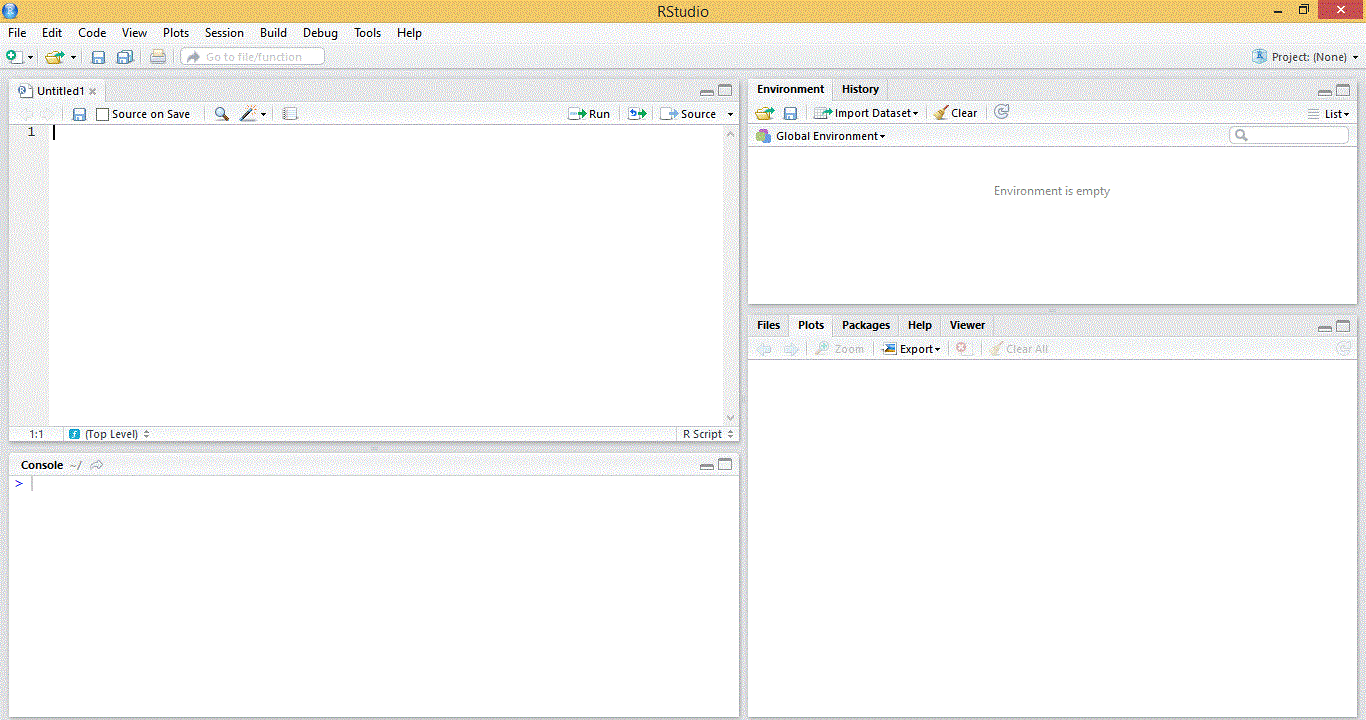
Please double click the the R-Studio icon and the following window opens

The left top most window is called 'source' where the r codes are usually written and left bottom window is the R-Console
where the codes are executed. Press the run button in the source window to run the code
Basic Concepts
There are few GUI available for R software
Starting the R environment (This page uses the R-Studio GUI for examples )
Please double click the the R-Studio icon and the following window opens

The left top most window is called 'source' where the r codes are usually written and left bottom window is the R-Console
where the codes are executed. Press the run button in the source window to run the code
Basic Concepts
1. Package and
Library
R software uses the concept called packages for various operations which needs to be downloaded and installed in the space
called R Library. To use the package, type the following syntax and press run
library
2. Frequently used packages
The following are the frequently used packages
3. Data in R
Data is stored and represented as vector in R software. The function "c" can be used to store the data as vector.
For example if want to store the age of 5 patients
> age = c(50,45,30,41,24) # R code
Here the age will be stored as vector age[].
> [1] 5 # R output
Age of first patient can be obtained by specifying the vector element age[1].
We can also use the following function to store data
1. Data entry through key in
age = scan()
# R code 2. Entry through data editor
age = c(0) # R code initial value of age to be changed in the editor
Data.entry(age) # R code
4. Basic Functions on Data
We can apply basic function on our data
>max(age) # R code maximum
>min(age) # R code minimum
>mean(age) # R code mean
>sd(age) # R code mean
>median(age) # R code median
>table(age) # R code frequency table
>summar(age) # R code to list summary - mean,max,min,median,1st quartile, 3quartile
R software uses the concept called packages for various operations which needs to be downloaded and installed in the space
called R Library. To use the package, type the following syntax and press run
library
2. Frequently used packages
The following are the frequently used packages
| S.No | Package | Type | remarks |
| 1 | stat | Basic Statistical function | Builtin |
| 2 | Randomforest | Classification and regression | |
| 3 | foreign | Data Connection | Read and write data from other packages such as SPSS and SAS |
| 4 | XL connect | Data Connection | Read and write data from excel |
| 5 | RODBC | Data Connection | Connect to a database through ODBC |
| 6 | xtable | Data Handling | |
| 7 | hmisc | Data Handling | |
| 8 | rcurl | Data Handling | |
| 9 | plyr | Data Handling | |
| 10 | pastecs | Descriptive Statistics | Display summary statistics |
| 11 | ggplot2 | Graphical display | Graphical display of data |
| 12 | lattice | Graphical Display | Graphical display of data |
| 13 | mlogit | Logit Model | Maximum Likelihood |
| 14 | nlme | Mixed Effects Model | Linear and Nonlinear |
| 15 | lme4 | Mixed Effects Model | Linear and Generalized S4 models |
| 16 | caret | Predictive Modeling | Predictive Modeling |
| 17 | xml | Reading and creating xml and html files | |
| 18 | Design | Regression | |
| 19 | Survey | Survey | |
| 20 | Survival | Survival Analysis | Survival Analysis |
| 21 | tm | Text Mining | Text Mining package |
3. Data in R
Data is stored and represented as vector in R software. The function "c" can be used to store the data as vector.
For example if want to store the age of 5 patients
> age = c(50,45,30,41,24) # R code
Here the age will be stored as vector age[].
> [1] 5 # R output
Age of first patient can be obtained by specifying the vector element age[1].
We can also use the following function to store data
1. Data entry through key in
age = scan()
# R code 2. Entry through data editor
age = c(0) # R code initial value of age to be changed in the editor
Data.entry(age) # R code
4. Basic Functions on Data
We can apply basic function on our data
>max(age) # R code maximum
>min(age) # R code minimum
>mean(age) # R code mean
>sd(age) # R code mean
>median(age) # R code median
>table(age) # R code frequency table
>summar(age) # R code to list summary - mean,max,min,median,1st quartile, 3quartile