
Windows Desktop Application
Σ Statistical Methods (StatsVinai)
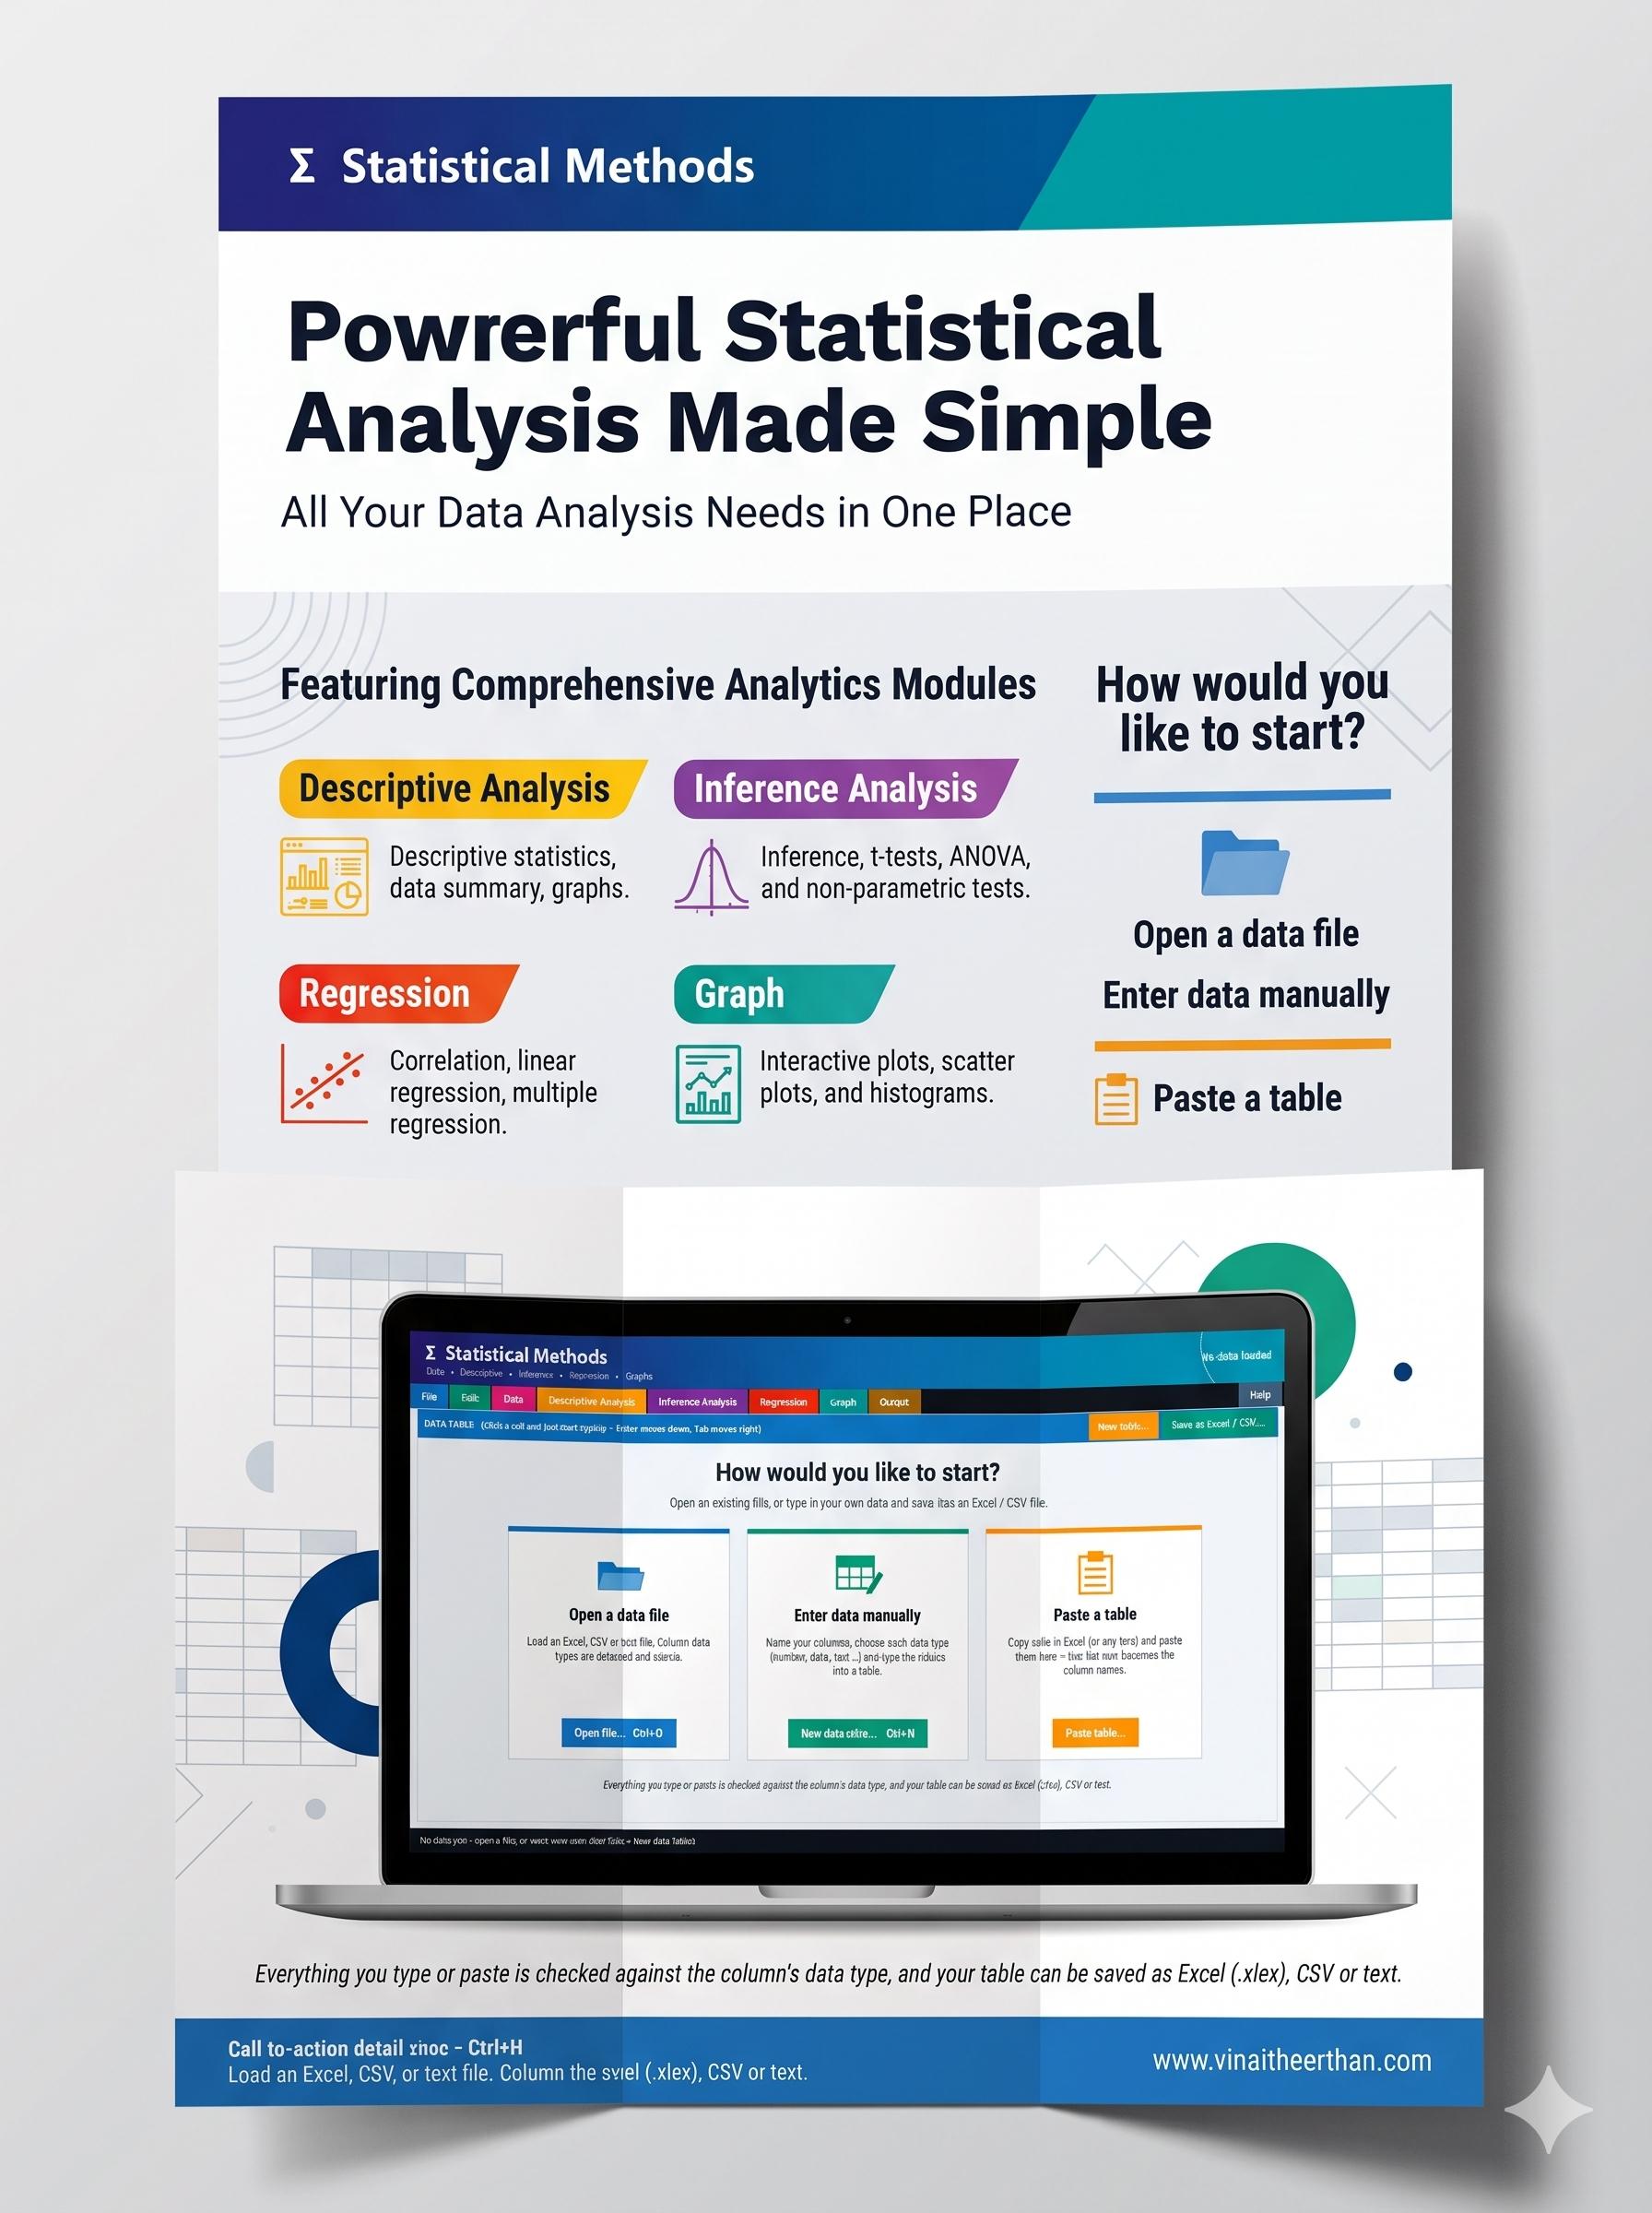
Data entry, cleaning, tests, regression and graphs in one desktop app. No coding needed.
Open an Excel (.xlsx, .xls), .csv, or .txt file, or type your own data into an Excel-like table. Pick an analysis from a menu, answer a short dialog, and read the result in plain language with a clear statistical decision line.
25
Graph Types
13
Regression Tools
12
Imputation Methods
19
Transform & Scale Options
From Raw Data to Report in Four Steps
1. Get Data In
Open an existing file, define a new table, or paste cells copied directly from Excel.
2. Clean It
Check quality, fix missing values, remove duplicates, recode, and validate 8 typed columns.
3. Analyse It
Run summaries, hypothesis tests, and regression from simple dialogs with zero syntax.
4. Report It
Export one task or all tasks to Excel, Word, PDF, or plain text reports.
Comprehensive Analytics Modules
Data Entry & Cleaning
- Spreadsheet-style typing with 8 validated data types (integer, decimal, date, category, etc.)
- Quality checks: profile reports, missing-data map, outliers, duplicates, and text consistency
- 12 imputation methods (mean, median, KNN, regression)
- Transformations: Log, Box-Cox, z-score, bins, dummies, lags & computed columns
- Reshape & combine: merge, append, pivot, group-by, melt, and 20-step undo
Descriptive & Inference Analysis
- Summary statistics with skewness, kurtosis, group-wise summaries & frequency tables
- Pearson, Spearman, and Kendall correlations with heat maps
- One-sample, Student, Welch, Paired t-tests, Mann-Whitney & Wilcoxon tests
- ANOVA with Tukey post-hoc, Kruskal-Wallis, Chi-square & normality tests
- Clear decision line on every test: significant (green) or not significant (orange)
13 Regression Tools
- 7 Linear Models: Simple, Multiple, Polynomial, Stepwise (AIC/BIC), Ridge, Lasso, Elastic Net, Robust & Quantile
- 5 Generalized Models: Logistic, Probit, Multinomial Logistic, Poisson, and Negative Binomial (with Odds Ratios, ROC & AUC)
- Nonlinear Curves: Compares 8 curve families (Exponential, Power, Logistic, Gaussian, Michaelis-Menten) ranked by AIC
25 Interactive Graph Types & Export
- Distribution (8): Histogram, density, ECDF, Q-Q, box, violin, strip
- Categorical (6): Bar, pie, donut, Pareto, stacked, cross-tab heat map
- Relationships (7): Scatter, regression band, bubble, hexbin, matrix, 3-D
- Trends (4): Line, area, moving average, control chart
- Zoom, pan, and save graphs; export reports to Excel (live cells), Word, PDF, or Text
Built for People Who Work With Numbers
Students
Learn tests and regression by doing, with an in-app guide on choosing methods.
Researchers
Clean survey and experiment data, run the test, export publication-ready tables and graphs.
Teachers
Demonstrate statistics live without installing a programming stack.
Analysts & Business
Profile, tidy, and summarize sales or customer data quickly.